Graph visualization is a crucial aspect of modern web applications, enabling the representation of complex relationships and data structures in an intuitive and visually appealing manner. ReactJS, a popular JavaScript library for building user interfaces, provides an ideal platform for creating dynamic and interactive graph visualizations. In this comprehensive guide, we’ll explore the key concepts, tools, and techniques for effective ReactJS graph visualization.

Table of Contents
ReactJS Graph Visualization

Understanding Graph Visualization
Graphs are mathematical structures composed of nodes and edges that represent connections between those nodes. Graph visualization involves rendering these structures in a graphical form, making it easier to interpret and analyze complex relationships within the data. Common use cases for graph visualizations include social networks, organizational hierarchies, and data flow diagrams.
Choosing the Right Library
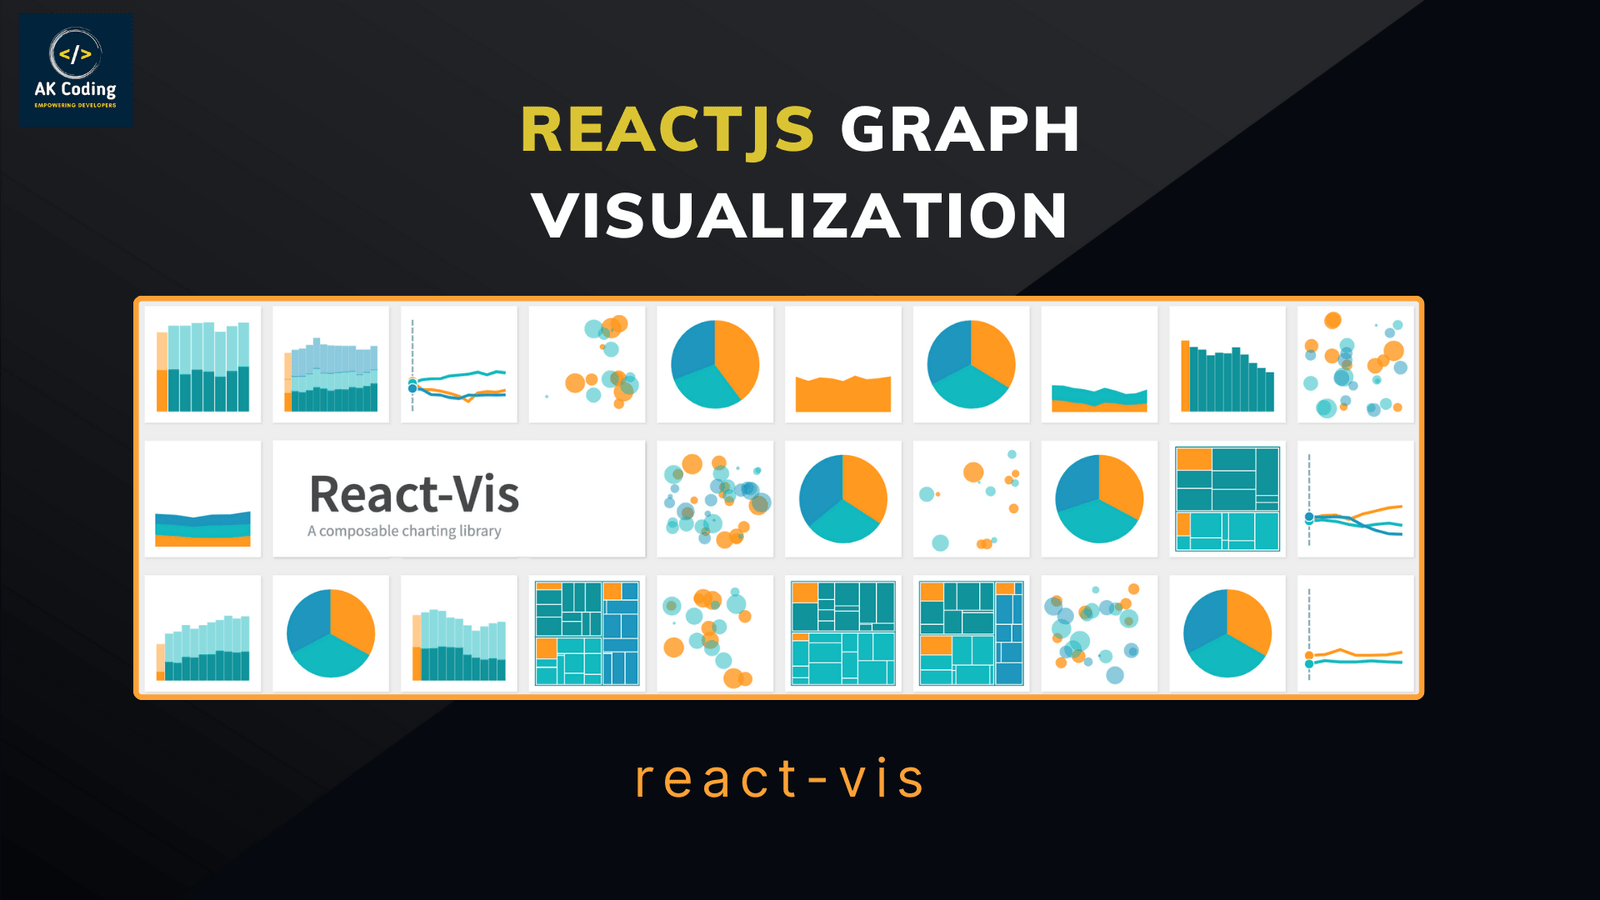
Several JavaScript libraries are designed specifically for graph visualization, and ReactJS can seamlessly integrate with these tools to create interactive and responsive graphs. One popular choice is the react-vis library, which is built on top of the powerful d3.js visualization library. react-vis provides a set of React components that simplify the process of creating various types of graphs, such as line charts, bar charts, and scatter plots.
Setting Up the Environment
Before diving into graph visualization, it’s essential to set up a React environment. Using tools like Create React App (CRA) simplifies this process, allowing developers to focus on building components rather than configuring the project. Once the environment is established, installing the react-vis library via npm provides the necessary components for creating dynamic graphs.
Here’s a basic example using react-vis to visualize a simple graph:
Install react-vis:
npm install react-visExample Code:
   import React from 'react';
   import { XYPlot, LineSeries, VerticalGridLines, HorizontalGridLines, XAxis, YAxis } from 'react-vis';

   const GraphVisualization = () => {
     const data = [
       { x: 0, y: 8 },
       { x: 1, y: 5 },
       { x: 2, y: 4 },
       { x: 3, y: 9 },
       { x: 4, y: 1 },
     ];

     return (
       <div>
         <h2>Graph Visualization Example</h2>
         <XYPlot width={300} height={300}>
           <VerticalGridLines />
           <HorizontalGridLines />
           <XAxis title="X-axis" />
           <YAxis title="Y-axis" />
           <LineSeries data={data} />
         </XYPlot>
       </div>
     );
   };

   export default GraphVisualization;
Rendering:
   import React from 'react';
   import ReactDOM from 'react-dom';
   import GraphVisualization from './GraphVisualization';

   ReactDOM.render(<GraphVisualization />, document.getElementById('root'));
In this example, we’re creating a simple line graph using the XYPlot, LineSeries, VerticalGridLines, HorizontalGridLines, XAxis, and YAxis components provided by react-vis. You can customize this based on your specific use case and data.
Remember to explore the react-vis documentation (https://uber.github.io/react-vis/) for more advanced features, including other types of graphs like bar charts, scatter plots, and more. Additionally, depending on your specific needs, you might explore other graph visualization libraries like vis.js, chart.js, or D3.js directly integrated into React components.
Handling Dynamic Data
Real-world applications often deal with dynamic data that changes over time. ReactJS, with its component-based architecture, excels at handling dynamic updates. When combined with libraries like react-vis, developers can seamlessly update graph visuals in response to changing data, providing a real-time and responsive user experience.
Exploring Advanced Features
As developers become more comfortable with basic graph visualization, they can explore advanced features offered by react-vis and other libraries. These may include stacked bar charts, radar charts, and network graphs. Additionally, integrating other data visualization tools like D3.js directly into React components provides even more possibilities for creating intricate and meaningful visualizations.
Optimizing Performance
Efficient performance is crucial, especially when dealing with large datasets. react-vis and similar libraries implement optimizations to ensure smooth interactions and quick rendering. Techniques such as data aggregation and lazy loading can further enhance performance when dealing with extensive or streaming data.
Other Popular graph library like “react-vis”
There are several other popular graph visualization libraries that work well with React, offering different features and customization options. Here are a few alternatives to “react-vis”:
- Vis.js:
- Description: Vis.js is a versatile and powerful JavaScript library for network and graph visualization. It supports a wide range of graph types, including dynamic networks, timelines, and hierarchical structures.
- React Integration: You can use the
react-visjslibrary to integrate Vis.js into React components, providing a React-friendly interface.
- D3.js:
- Description: D3.js is a widely-used data visualization library that provides a low-level API for creating custom visualizations. It’s highly flexible and supports a variety of chart types, including graphs and networks.
- React Integration: Several React wrapper libraries, such as
react-d3-graphandreact-d3-tree, make it easier to integrate D3.js with React applications.
- Cytoscape.js:
- Description: Cytoscape.js is a graph theory library for visualizing and analyzing graphs. It’s particularly powerful for displaying large and complex networks.
- React Integration: The
react-cytoscapejslibrary allows you to integrate Cytoscape.js seamlessly into React applications.
- Sigma.js:
- Description: Sigma.js is a lightweight JavaScript library for graph drawing. It is designed to handle large-scale graphs efficiently and offers a variety of customization options.
- React Integration: You can use the
react-sigmalibrary to integrate Sigma.js with React components.
- Nivo:
- Description: Nivo is a declarative data visualization library for React that supports various chart types, including network graphs. It provides a high-level API for creating visually appealing and responsive graphs.
- React Integration: Nivo is a standalone React library, and you can directly incorporate its components into your React application.
- Chart.js:
- Description: While primarily known for its support of traditional charts, Chart.js also offers a basic network graph feature. It’s suitable for smaller-scale graphs with simpler requirements.
- React Integration: You can use the
react-chartjs-2library to integrate Chart.js with React applications.
When selecting a graph visualization library, consider factors such as the complexity of your data, the level of customization required, and the specific features offered by each library. The choice often depends on the nature of your project and the specific visualization needs you have.
Conclusion
In conclusion, ReactJS provides an excellent foundation for building dynamic and interactive graph visualizations. Leveraging libraries like react-vis simplifies the implementation of various graph types while offering extensive customization options. Whether you’re visualizing hierarchical structures, network relationships, or time-series data, ReactJS empowers developers to create compelling and informative graph visualizations that enhance the overall user experience. As you delve deeper into ReactJS graph visualization, experimentation and exploration of advanced features will open new possibilities for creating impactful and visually engaging data representations.
Github doc link
https://github.com/uber/react-vis#readme
To Learn React js visit https://akcoding.com/react-js


